
Dashboard
2. Dashboard
The Dashboard is the first screen you see when logging into SLZB-OS.
It provides an at-a-glance overview of your device’s current status, connectivity, and Zigbee network health.
From here, you can quickly access detailed sections via the top or side navigation menus.
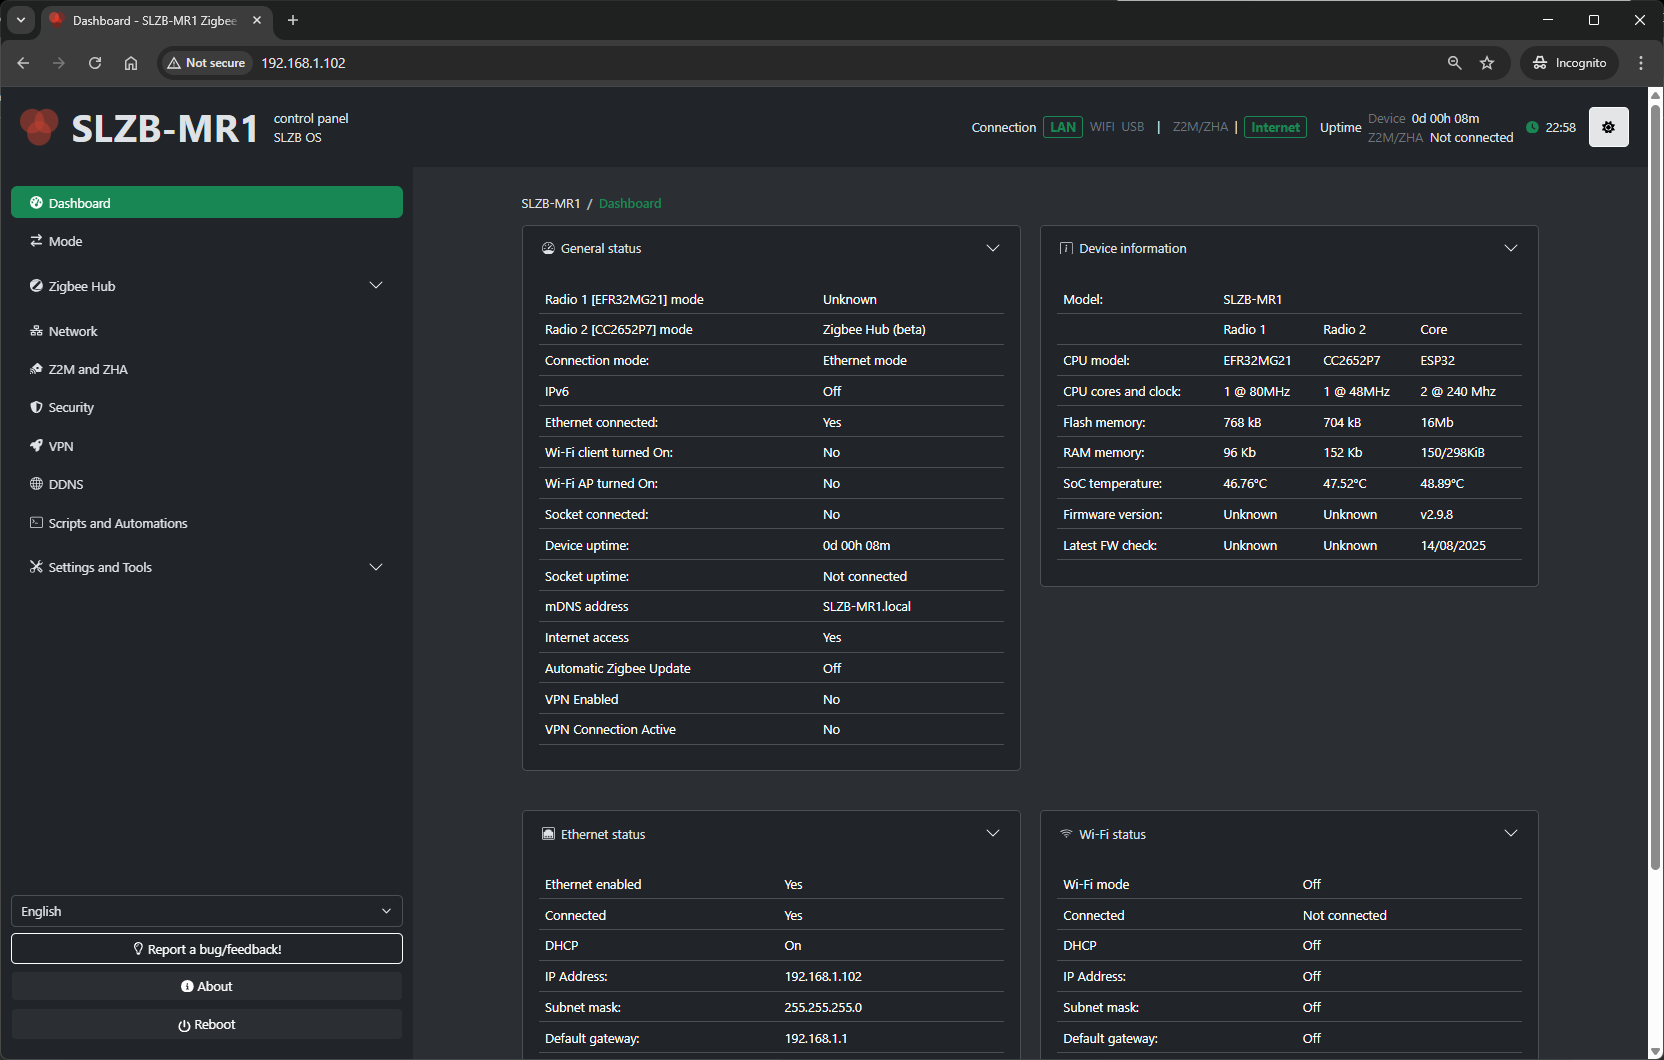
2.1 Layout Overview
The dashboard typically consists of the following key blocks:
-
Device Status Panel
-
Model – Displays the hardware model (e.g., SLZB-MR1U).
-
Firmware Version – Current SLZB-OS version installed.
-
Uptime – How long the device has been running since last restart.
-
CPU & Memory Usage – Real-time resource utilization.
-
-
Network Status
-
IP Address – Current assigned IPv4 address.
-
Connection Type – Ethernet, PoE, USB, or Wi-Fi (depending on model).
-
MAC Address – Unique network identifier.
-
Link Status – Connection state and link speed.
-
-
Zigbee Hub Summary
-
Coordinator State – Online/Offline status.
-
Connected Devices – Number of active Zigbee devices.
-
Last Message – Timestamp of the last received Zigbee event.
-
Zigbee2MQTT / ZHA Status – Shows which integration is currently active.
-
-
Quick Actions
-
Restart Device – Reboots the SLZB device.
-
Restart Zigbee Hub – Restarts Zigbee coordinator service without rebooting the whole system.
-
Open Zigbee2MQTT Web UI – Shortcut to Z2M frontend (if enabled).
-
Check for Firmware Update – Quick link to update page.
-
2.2 Indicators & Colors
-
Green – Normal operation.
-
Yellow/Orange – Warning or degraded performance (e.g., high CPU usage).
-
Red – Critical issue (e.g., coordinator offline).
2.3 Typical Uses
-
Monitoring – Quickly verify if both network and Zigbee hub are running normally.
-
Troubleshooting – Identify offline status or high resource load.
-
Fast Navigation – Jump directly to network or Zigbee hub settings.